Liquid-Level Measurement System Uses a Compensated Silicon Pressure Sensor and Precision Delta-Sigma ADCs, Part 1
详情介绍
Introduction
This reference design is the first in a series on liquid-level measurement and control. Here in Part 1, differences among modern pressure sensors and emphasizes the benefits of recent advances in microelectromechanical (MEMS) temperature-compensated, silicon pressure sensors are described. Now reasonably priced and available in a variety of packages, these sensors are attractive for a wide variety of precision sensing applications, including liquid level measurements. The document then describes a cost-effective, low-power, liquid-level measurement data acquisition system (DAS) using a compensated silicon pressure sensor and a high-precision delta-sigma ADC. The article will explain how to select the compensated silicon pressure sensor. It will suggest system algorithms, analyze noise, and offer calibration ideas for improving system performance while reducing complexity and cost.
Measuring Pressure—a Look Back
It could be argued that modern pressure measurement was started by the Italian physicist Evangelista Torricelli1 through his invention in 1643, the mercury barometer. Torricelli filled a glass tube one meter long with mercury, hermetically closed the tube at one end, and set it vertically with the open end in a vessel filled with mercury. The column of mercury fell to about 760mm, leaving an empty space above its level. The pressure unit, Torr, was named in honor of this inventor and has a ratio of 1 to 760 standard atmospheres. Blood pressure2 is measured in Torr (millimeters of mercury) in most of the world. Contemporary pressure units include the Pa (Pascal) defined by System International (SI) as the main pressure unit (Pa = N/m²). In the U.S. a popular pressure-measurement unit is the "bar" which measures pounds per square inch (PSI). Conversion to a standard unit measure among the various pressure units is quite a cumbersome task because of historical and technical reasons. Nonetheless, the widely available free conversion tables or free online unit converters can make the task easier for engineers. There are two main categories of pressure sensors classified by type of the measurement:
- Absolute pressure sensor, which measures the pressure relative to perfect vacuum pressure. An example of an absolute pressure sensor is the mercury (Hg) barometer shown in Figure 1.
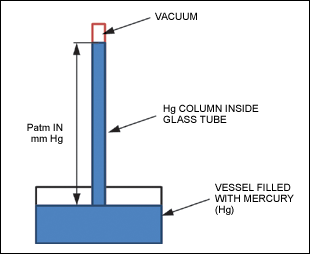
Figure 1. Mercury (Hg) in the barometer tube adjusts until the weight of its column balances the atmospheric force. Patm is exerted on the open reservoir. - Differential pressure sensor, which measures the difference between two or more pressures introduced as inputs to the sensing unit. An application example of such a sensor is the differential pressure flow meter (Figure 2) where change in the velocity of the fluid produces a change in the pressure and creates a pressure difference, ΔP = P1 - P2.
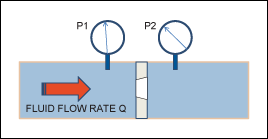
Figure 2. For this type of flow meter, the volume flow rate, Q, is related to ΔP by a simple formula that measures the rate of the flow and, consequently, determines consumption.
A gauge pressure sensor is another type of differential sensor that is constructed to measure the relative pressure to an atmospheric pressure. An example of this sensor is the popular tire-pressure gauge. When the tire-pressure gauge reads zero, it is really reading atmospheric pressure at a given location.
Advent of the Modern Pressure Sensor
Many industrial, commercial, and medical applications require precision pressure measurements with ±1% to ±0.1% or better accuracy over a wide dynamic range, with reasonable cost, and often with very low power consumption. The development of a silicon pressure sensor was the answer to these challenges. The modern sensor age started in 1967 at the Honeywell Research Center where Art R. Zias and John Egan applied for patents on the edge-constrained silicon diaphragm.3 Since the mid-1990s, the piezoresistive, silicon-based pressure sensors called MEMS have been manufactured cost effectively in high volumes and, consequently, became the most popular pressure sensor. A MEMS device works for pressure ranges from 100mbar to 1500bar in the absolute, differential, and gauge pressure modes. Piezoresistive, silicon-based pressure sensors demonstrate substantially higher sensitivities than standard strain gauges; they have good linearity at constant temperature and acceptable hysteresis up to the destructive limit. These sensors also have some disadvantages, dictated by their "silicon" nature: strong nonlinear dependence of the fullscale signal on temperature, large initial offset, and large offset drift with temperature.4 Many industrial and automotive applications require pressure measurements in the extended temperature range (-40°C to +125°C). To achieve precision pressure measurements with ±1% or better accuracy in this wide temperature range, at least a first-order temperature compensation needs to be implemented:
| VDIFF = VOS + TαVOS + P(S + TαS) | (Eq. 1) |
Where:
VDIFF is the differential voltage versus pressure, P, and temperature, T;
αS is the temperature coefficient of sensitivity;
αVOS is the temperature coefficient of offset. An analog signal-conditioning approach for piezoresistive sensors is exemplified by the MAX1450. This signal conditioner can be applied to the uncompensated sensors and across -40°C to +125°C extended temperature ranges (Figure 3). 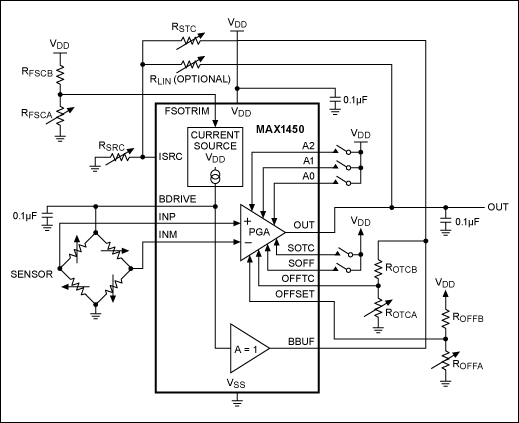
Figure 3. The circuit's initial sensitivity (FSO) is adjusted at the FSOTRIM pin. The temperature drift is adjusted by feeding back the sensor's drive voltage from the BDRIVE pin to the ISRC pin. Compensation of offset and offset drift is accomplished with the programmable gain amplifier (PGA) and decoupled from the sensitivity compensation. The key function, however, is the controlled current source, which implements a unique algorithm for compensating the sensitivity drift. A later generation IC for conditioning sensor signals (MAX1455) integrates programmable sensor excitation, a 16-step programmable-gain amplifier (PGA), 768-byte (6144 bits) internal EEPROM, and four 16-bit DACs used for FSO, offsets, and span compensation.5
Temperature-Compensated Pressure Sensors: a Versatile, Lower Cost Solution for Some Applications
Many modern industrial processes, as well as commercial and medical applications, do not require an extended temperature range. Moreover, some of these applications actually operate in an air-conditioned environment where the temperature range is quite restricted. Temperature-compensated silicon pressure sensors are well suited for these applications. Freescale® Semiconductor and OMROM® temperature-compensated silicon pressure sensors are available in small sizes with prices typically in the medium, single-dollar range, depending on the package type. These sensors reduce the cost substantially and, equally important, give designers the flexibility to place sensors on any type of printed circuit board (PCB). One example is the popular and cost-effective MPX2010 series silicon piezoresistive pressure sensor from Freescale Semiconductor, which provides temperature compensation in the range of 0°C to +85°C. Table 16 shows important operating characteristics and systematic errors of the MPX2010 at room temperature.
| Table 1. MPX2010 Important Operating Characteristics and Error Analysis | ||||
| Characteristic | Units | Value | Error (%FS) | Notes |
|---|---|---|---|---|
| Pressure range, pop | kPa | 0 to 10 | — | — |
| Typical supply voltage, VPPT | V | 10 | — | — |
| Supply current, IPT | mA | 6 | — | — |
| Fullscale span, VFST | mV | 25 ±1 | ±4 | Can be compensated by fullscale calibration |
| Temperature coefficient on fullscale span | %FS | ±1 | ±1 | — |
| Offset | mV | ±1 | ±4 | Can be compensated by offset calibration |
| Temperature coefficient on offset | mV | ±1 | ±4 | — |
| Linearity | %FS | ±1 | ±1 | — |
| Pressure hysteresis | — | — | — | — |
| (0 to 10kPa) | — | ±0.1 | ±0.4 | — |
Table 1 shows that although this temperature-compensated pressure sensor has ±1% linearity and only ±0.4% hysteresis, the offset and fullscale errors lower its overall accuracy to 4% at a constant temperature. At this point, a new precision delta-sigma ADC becomes critically important to a design. By applying the offset and fullscale system calibration available in the ADC, the sensor's overall measurement precision can be improved to around ±1% or better. Moreover, with high noise-free resolution, excellent common-mode 50Hz/60Hz rejection, and well-integrated buffers, these delta-sigma ADCs can directly interface with silicon piezoresistive pressure sensors without additional instrumentation amplifiers or dedicated current sources. Some important characteristics of the MAX11200 family of delta-sigma ADCs are listed in Table 2.
| Table 2. MAX11200 Key Specifications | ||
| MAX11200 | Comments | |
|---|---|---|
| Sample rate (sps) | 10 to 120 | The MAX11200's variable oversampling rate can be optimized for low noise and for -150dB line-noise rejection at 50Hz or 60Hz. |
| Channels | 1 | GPIOs allow external multiplexer control for multichannel measurements. |
| INL (max, ppm) | ±10 | Provides very good measurement linearity |
| Offset error (µV) | ±1 | Provides almost zero offset measurements |
| Noise-free resolution (bits) | 19.0 at 120sps; 19.5 at 60sps; 21.0 at 10sps | Very high dynamic range with low power. |
| VDD (V) | AVDD (2.7 to 3.6) DVDD (1.7 to 3.6) |
AVDD and DVDD ranges cover the industry's popular power-supply ranges. |
| ICC (max, µA) | 300 | Highest resolution-per-unit power in the industry; ideal for portable applications |
| GPIOs | Allows external device control, including local multiplexer control | |
| Input range | 0 to VREF, ±VREF | Wide input ranges |
| Package | 16-pin QSOP, 10-pin µMAX® (15mm²) |
10-pin µMAX package offers very small size for space-constrained designs. |
With its direct interface to the low-noise delta-sigma ADCs, the MPX2010 pressure sensor now provides a cost-effective measurement system optimized for portable sensing applications.
Case Study: Liquid Level Measurement with a Pressure Sensor
Here we will evaluate a system design using a pressure sensor and delta-sigma ADC to accurately measure water level. The level (height) of the liquid will be determined based on the pressure produced by hydrostatic column of the liquids at the bottom of this container and measured at the end of the measurement tube. The pressure sensor will have atmospheric pressure on one side and compressed air (by liquid) on the other. (See Figure 6.) The MPXM2010GS is used to differentially measure the pressure. Assuming a constant density throughout the liquid and a negligible variation of the earth's gravitational acceleration, hydrostatic pressure can be derived by a simple formula:
| P = D × G × H | (Eq. 2) |
Where:
P is hydrostatic pressure (Pa);
G is gravitational acceleration (9.8066m/s²);
D is the liquid density (kg/m³);
H is the height of the liquid column (m). Resolving Equation 2 for H:
| H = P/(D × G) | (Eq. 3) |
In general, liquid density varies with changes in temperature. For example, the density of water increases between its melting point at 0°C and +4°C, reaching a standard value of 999.972 (practically 1000) kg/m³ at +4°C. At room temperature, +22°C, the density of water is 997.774kg/m³. All measurements in this article were done at room temperature around +22°C, ±3°C, where water density variation is around ±0.1%. Note that this is below the targeted precision for the DAS referenced in this article. For a typical MPX2010 fullscale range of 10kPa, the water height equivalent is 1.022m. A standardized, convenient, water height value of 1m (1000mm) was used for the fullscale calibration of the water-level measurement system. Figure 4 shows a simplified block-diagram of the pressure-measurement DAS. 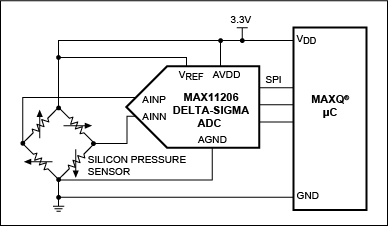
Figure 4. Drawing shows the implementation of the pressure-measurement DAS with direct interface to the compensated, silicon pressure sensor utilizing a ratiometric approach. This design allows the use of the analog power supply as a reference. The height of the liquid can be derived by the formula:
| HOUT = HFS × (AADCOUT/AADCFS) | (Eq. 4) |
Where:
HOUT is the measured height of the liquid column (m);
HFS is the fullscale measured height (1m for water) of the liquid column (m);
AADCOUT is the measured ADC output code;
AADCFS is the fullscale measured ADC output code. Figure 4 shows that the silicon pressure-sensor measurement element represents a resistive bridge that allows use of a ratio metric approach7 to estimate the fullscale voltage span at a reduced power-supply voltage of 3.3V:
| VFS = VFST × (VDD/VPST) | (Eq. 5) |
Where:
VFS is the fullscale system span (Figure 4) at the maximum pressure, PFS = 10kPa;
VDD is the excitation voltage with VPST as the typical excitation value. We know that for VPST = 10V, the sensor voltage swing is VFST = 25mV. Since we are applying only a 3.3V excitation, we get:
| VFS = 25mV × (3.3/10) = 8.25mV (fullscale span at 3.3V) | (Eq. 6) |
A simplified schematic of the precision DAS used for the liquid-level measurement system is shown in Figure 5. 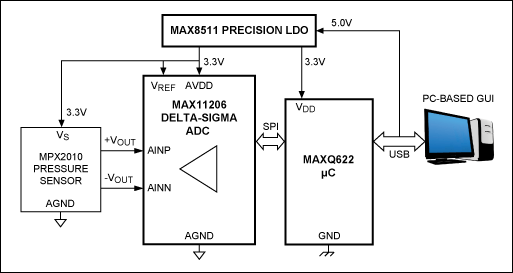
Figure 5. Compensated silicon pressure sensors directly interface with MAX11206 ADC while the MAX8511 precision LDO provides 3.3V power and reference voltages. A MAXQ622 microcontroller supports data collection from the ADC and supplies the USB interface to a PC. This DAS also includes a PC-generated GUI. The MAX11206 used in this article is a 20-bit delta-sigma ADC suitable for low-power applications that require a wide dynamic range. It has an extremely low input-referred RMS noise of 570nV at 10sps. The noise-free resolution (NFR) is around 6.6 × RMS noise and represents a value of 3.762µV. (This is called flicker-free code.) The calculations below provide estimates for the resolution at fullscale height measurement of HFS = 1022mm.
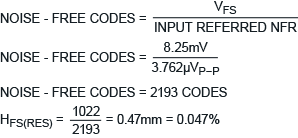
The estimated fullscale resolution at ±0.047% is more than sufficient to achieve the DAS's target precision of ±1% in this reference design. This proves that the ADC can directly interface with a new compensated silicon pressure sensor without the need for additional instrumentation amplifiers. Figure 6 shows the development system of Figure 5. This system features a water-level system "calibrator" consisting of a vertical 1m long plastic water-filled tube, equipped with 1mm resolution measurement tape. The measurement tube is located inside the calibrator water tube; it connects directly to the sensor's positive pressure port, while the reference pressure port is exposed to the atmospheric pressure.
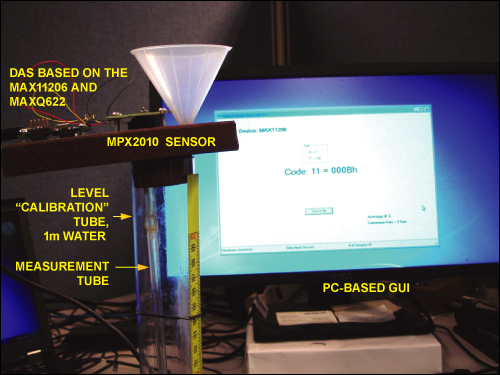
Figure 6. The development system for Figure 5. Hydrostatic pressure produced by the water column at the bottom of the calibrator tube is producing the same amount of pressure on the sensor through the trapped air in the measurement tube. At its output, the MPX2010 sensor produces a pressure equivalent voltage measured and digitized by the MAX11206 ADC, processed by the microcontroller MAXQ622, and finally sent to a PC though the USB cable. Table 3 lists measurement and calculations using Equation 4 for the 1m measurement range.
| Table 3. System Calibration for the ADC-Based DAS | ||||
| Calibrator Water Level (H, mm) | MAX11206 Output Code (LSB) | Measured Water Level per Eq. 4 (mm) | Absolute Error (mm) | FS Error (%) |
|---|---|---|---|---|
| 0 | 0 | 0 | 0 | 0 |
| 100 | 114 | 98.5 | 1.5 | 0.1 |
| 200 | 225 | 194.5 | 5.5 | 0.6 |
| 300 | 343 | 296.5 | 3.5 | 0.4 |
| 400 | 459 | 396.7 | 3.3 | 0.3 |
| 500 | 576 | 497.8 | 2.2 | 0.2 |
| 600 | 693 | 599.0 | 1.0 | 0.1 |
| 700 | 809 | 699.2 | 0.8 | 0.1 |
| 800 | 924 | 798.6 | 1.4 | 0.1 |
| 900 | 1042 | 900.6 | -0.6 | -0.1 |
| 1000 | 1157 | 1000.0 | 0.0 | 0.0 |
As Table 3 shows, by using a system calibration and Equation 4, the MAX11206-based DAS achieves better than ±1% precision over a fullscale water height level of 1m (1000mm).
Conclusion
New MEMS temperature-compensated, silicon pressure sensors are dropping in price and package size. This is making them attractive for a wide variety of precision sensing applications, such as liquid level measurements or flow metering. These applications require a low-noise delta-sigma ADC such as the MAX11206 to directly interface to the PCB-mounted silicon pressure sensors. With simple compensation schemes, this approach easily increases the absolute accuracy of these pressure sensors. Together, the silicon pressure sensors and the ADC provide a high-performance, cost-effective measurement system Features such as high noise-free resolution, integrated buffers, excellent common mode dynamic range, 50/60Hz rejection, and system calibration allow the MAX11206 to be directly interfaced with new silicon pressure sensors such as the MPXM2010, without the need for additional instrumentation amplifiers or dedicated current sources. Reduction in the thermal errors also allows designers to implement simple linear algorithms, which further reduces system complexity and cost. This control and delivery system is further discussed in reference design 5523, "Liquid-Level Measurement System Uses a Compensated Silicon Pressure Sensor and Precision Delta-Sigma ADCs, Part 2," which explains how to implement a design that measures and distributes most industrial liquids using a noncontact measurement approach.
References
- For more information on Evangelista Torricelli, you can start here: http://en.wikipedia.org/wiki/Evangelista_Torricelli.
- For more information, go to http://en.wikipedia.org/wiki/Blood_pressure.
- For more information, go to www.kelleramerica.com/history-of-pressure-measurement/.
- Application note 871, "Demystifying Piezoresistive Pressure Sensors."
- Application note 840, "MAX1455 Diagnostic Clip Boost Circuit."
- Freescale Semiconductor,"10 kPa On-Chip Temperature Compensated and Calibrated Silicon Pressure Sensors." www.freescale.com/files/sensors/doc/data_sheet/MPX2010.pdf.
- Application note 3775, "Design Considerations for a Low-Cost Sensor and A/D Interface."